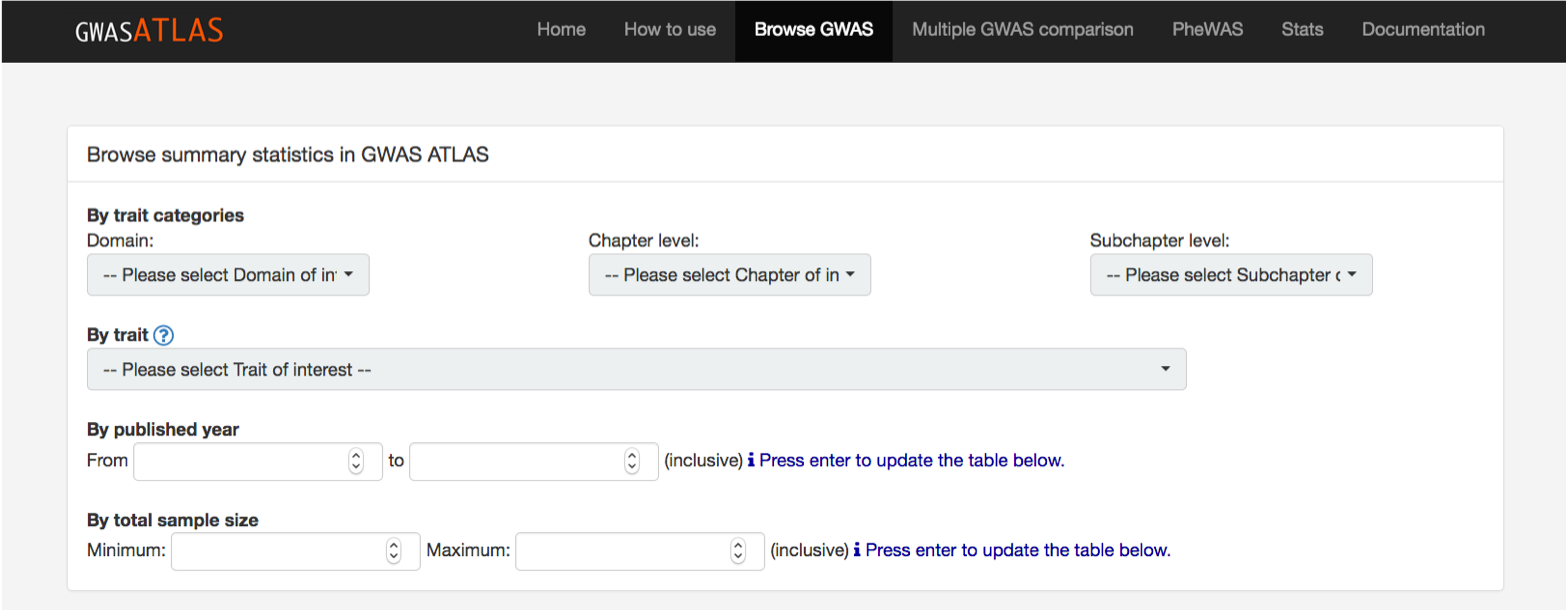
From the "Browse GWAS" page, you can search GWAS summary statistics in the database by trait name.
You can search any key word from search box.
Traits can also be filtered by published year and sample size in the filtering boxes.
The atlas of GWAS summary statistics only contains GWAS summary statistics when results of full SNPs are publicly available without any application to access.
Non-GWAS results such as WES or customised chip studies are not included (for the current version).
Please also check the latest release of the database from the home page.
If the GWAS is already published and full results are publicly available, but you can't still find them in the database,
please report the GWAS from Report GWAS page.
We appreciate your contribution to make the database comprehensive!!
The atlas ID for each trait is a unique identifier in the database.
The ID itself dose not mean anything and the order of traits in the database is arbitrary.
Top SNPs are the SNPs with the minimum P-value in each genomic risk locus.
For each GWAS in the database, risk loci are defined as described previously
[Watanabe et al. 2017].
See documentation 4. Definition of lead SNPs and risk loci for details.
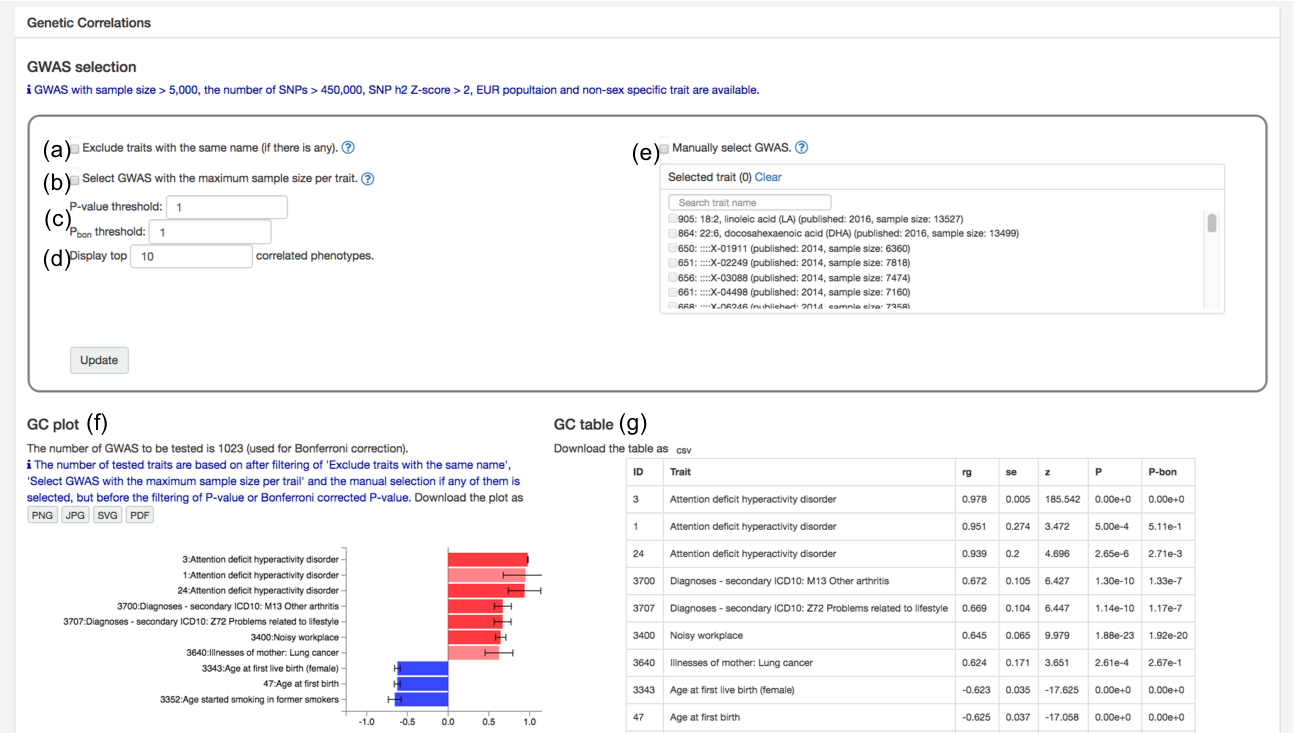
At the bottom of the trait page, you can find a plot and table of genetic correlation of the selected GWAS with the other GWAS in the database.
By default, top 10 traits with the highest absolute genetic correlation are
displayed regardless of significance.
Nothing is shown for traits which are not eligible for estimation of genetic correlation
(see 5.3. Genetic correlation in the Documentation).
Several options are available to obtain genetic correlation with a custom list of traits as the followings.
(a) Exclude traits with the same name: If there is any other traits with the same name in the "uniqTrait" feature in the database, those can be excluded by activating this option.
(b) Select GWAS with the maximum sample size per trait: For traits with more than one GWAS in the database, one with the largest sample size is selected per trait. Note that this selection is performed after other filtering options.
(c) P-value and Bonferroni corrected P-value threshold.
(d) The number of traits to display. (e) Manual selection of trait: Traits can also be manually selected. Other filtering options are still performed on the selected traits.
(f) Genetic correlation plot: Each bar is colored based on P-value; grey for P-value ≥ 0.05, high transparency red (positive) and blue (negative) for P-value < 0.05, and red or blue for P-value < Pbon. Bonferroni correction is performed for the number of possible pairs after filtering based on selected options but before the filtering of P-value.
(g) Genetic correlation table: same as (f) but in table format.
In the "Multi GWAS comparison" page, there is a same database table and filtering options as "Browse GWAS" page.
You can search your traits and click check box manually.
Once a trait is checked, this remains when you search another trait.
For example, you first search for schizophrenia and check one of the GWAS.
Next you search body mass index which shows several entries of GWAS.
The selected GWAS for schizophrenia is not in the filtered table but it remained selected as you can notice from the number of selected GWAS at the top of the table.
There are two buttons to select "all GWAS in the table" and "all displayed GWAS".
The former checks all GWAS in the current filtered table while the later select only the ones displayed.
For example, when you filter GWAS on traits in Psychiatric domain, the "select all GWAS in the table" will check all psychiatric traits,
but "select all displayed GWAS" only checks 10 GWAS which hare visible.
You can change the number of entries to display at the upper left size of the table.
By combining these buttons, you can effectively select large number of traits.
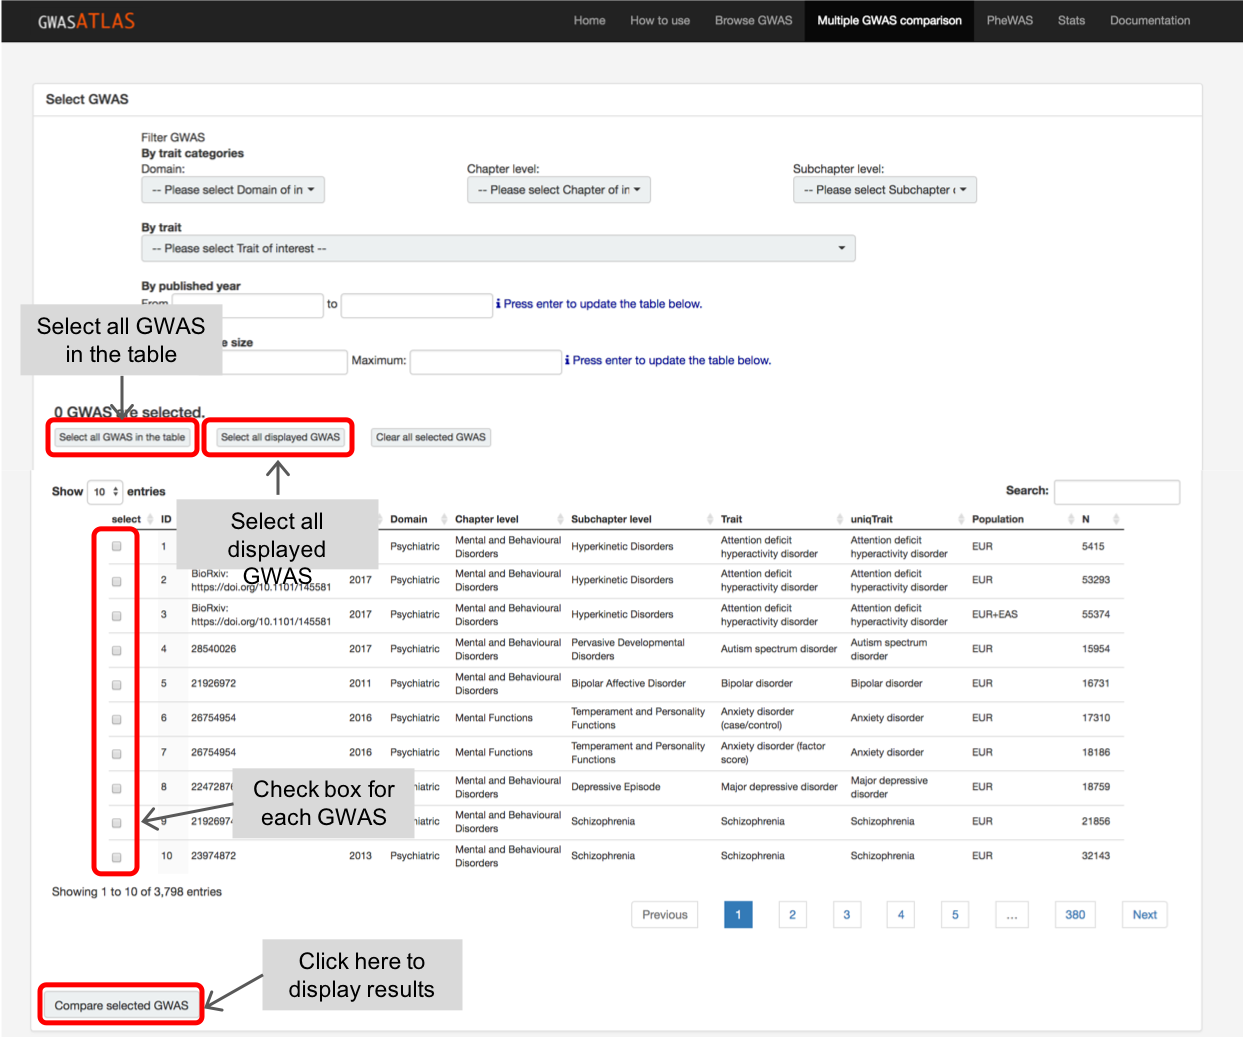
In the "Multi GWAS comparison" page, select GWAS that you want to compare and press "Compare selected GWAS" button.
This will create multiple plots including genetic correlation heatmap.
GWAS can be sorted by alphabetically, trait domain or hierarchical clustering.
The plot can be downloaded as a image and data can be downloaded in json format.
The downloaded json file can be used to customise the plot with j3.ds script available at
https://github.com/Kyoko-wtnb/GWASatlas-plots.
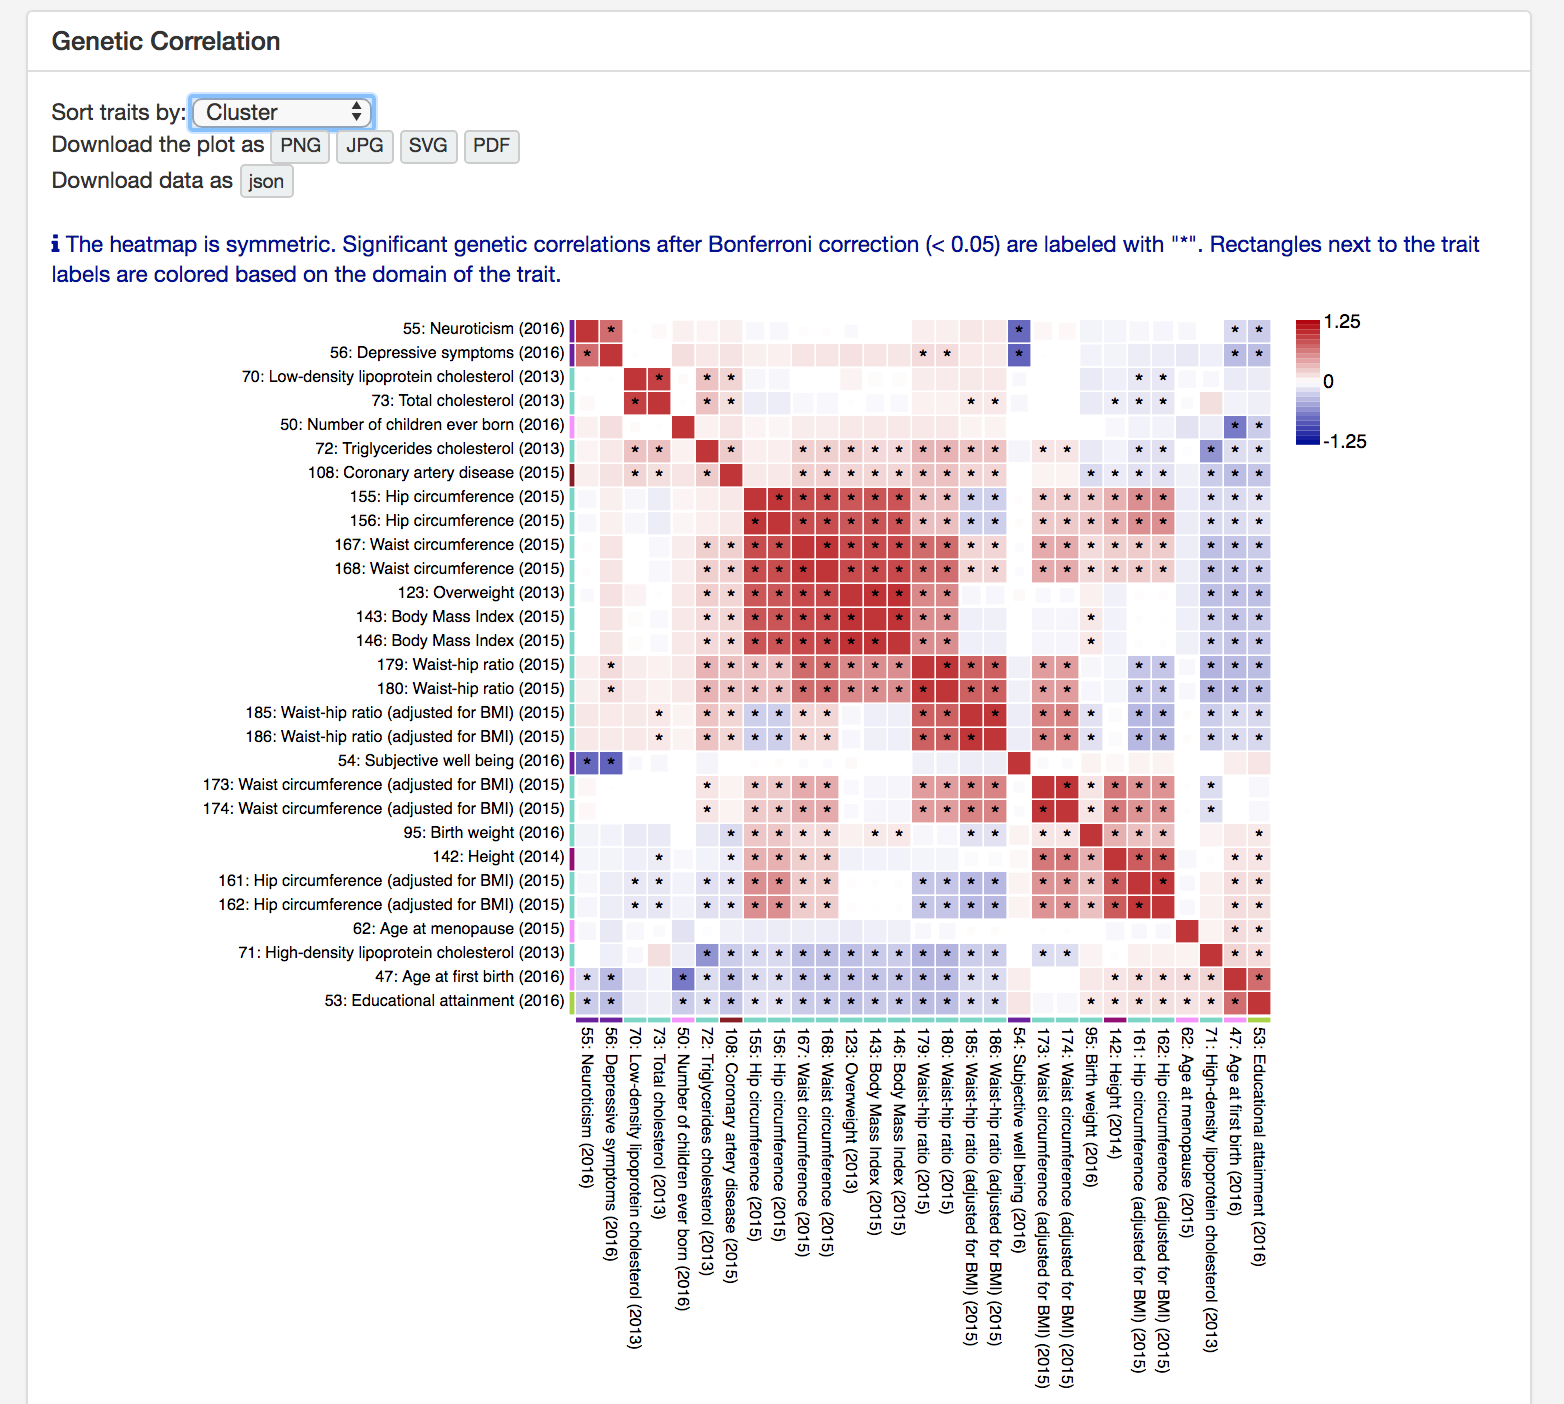
Genetic correlation was estimated only for traits that meet several criteria.
See documentation 5. Estimation of SNP heritability and genetic correlatoin for details.
Since it reduce the interface performance to display large heatmap, when there are more than 100 GWAS,
the website does not display the heatmap.
However, you can download the data in json format and create heatmap on your local computer with d3.js script available at
https://github.com/Kyoko-wtnb/GWASatlas-plots.
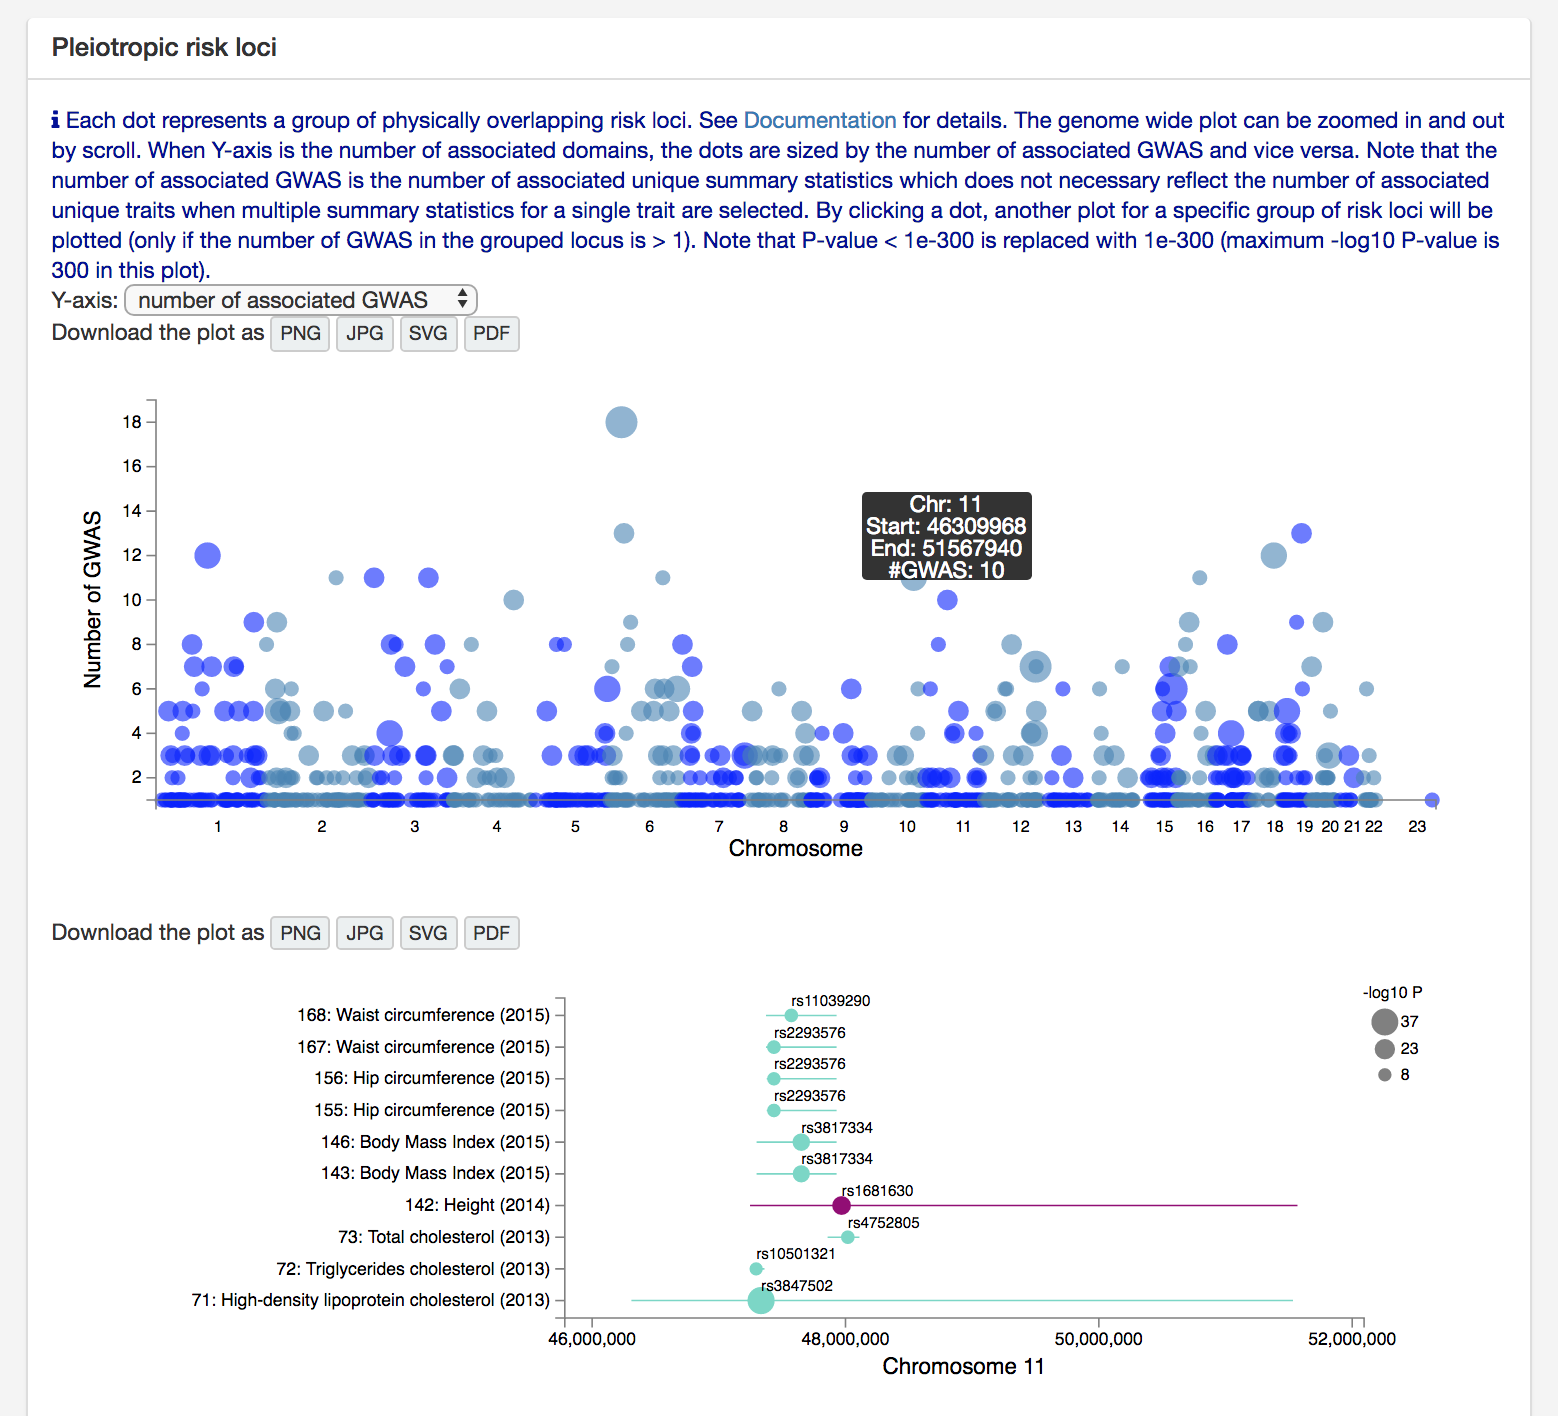
At the second last box on the "Multiple GWAS Comparison" page, there is a manhattan like plot for pleiotropic risk loci.
Each data point represent a group of physically overlapping risk loci.
See documentation 7. Multi GWAS comparison for details.
Y-axis is the number of associated domains by default which can be changed to the number or associated GWAS
(the bottom plot uses number of associated GWAS for Y-axis).
As a measure of pleiotropy, we recommend to use the number of associated domains when you have multiple traits from multiple
domains since traits within a domain tend to have higher phenotypic correlation.
When you are comparing traits within one or a few domains, or you don't suspect high phenotypic correlation between selected traits within a domain,
the number of associated GWAS might be better measurement for pleiotropy.
Note that the number of associated GWAS is the number of unique summary statistics.
Therefore, this does not necessary represent the number of unique trait when multiple summary statistics for a single trait are selected.
By clicking one of the risk loci groups, you can visualise overlapping risk loci at the bottom of the manhattan plot.
By clicking one of the risk loci groups, you can visualise overlapping risk loci at the bottom of the manhattan plot.
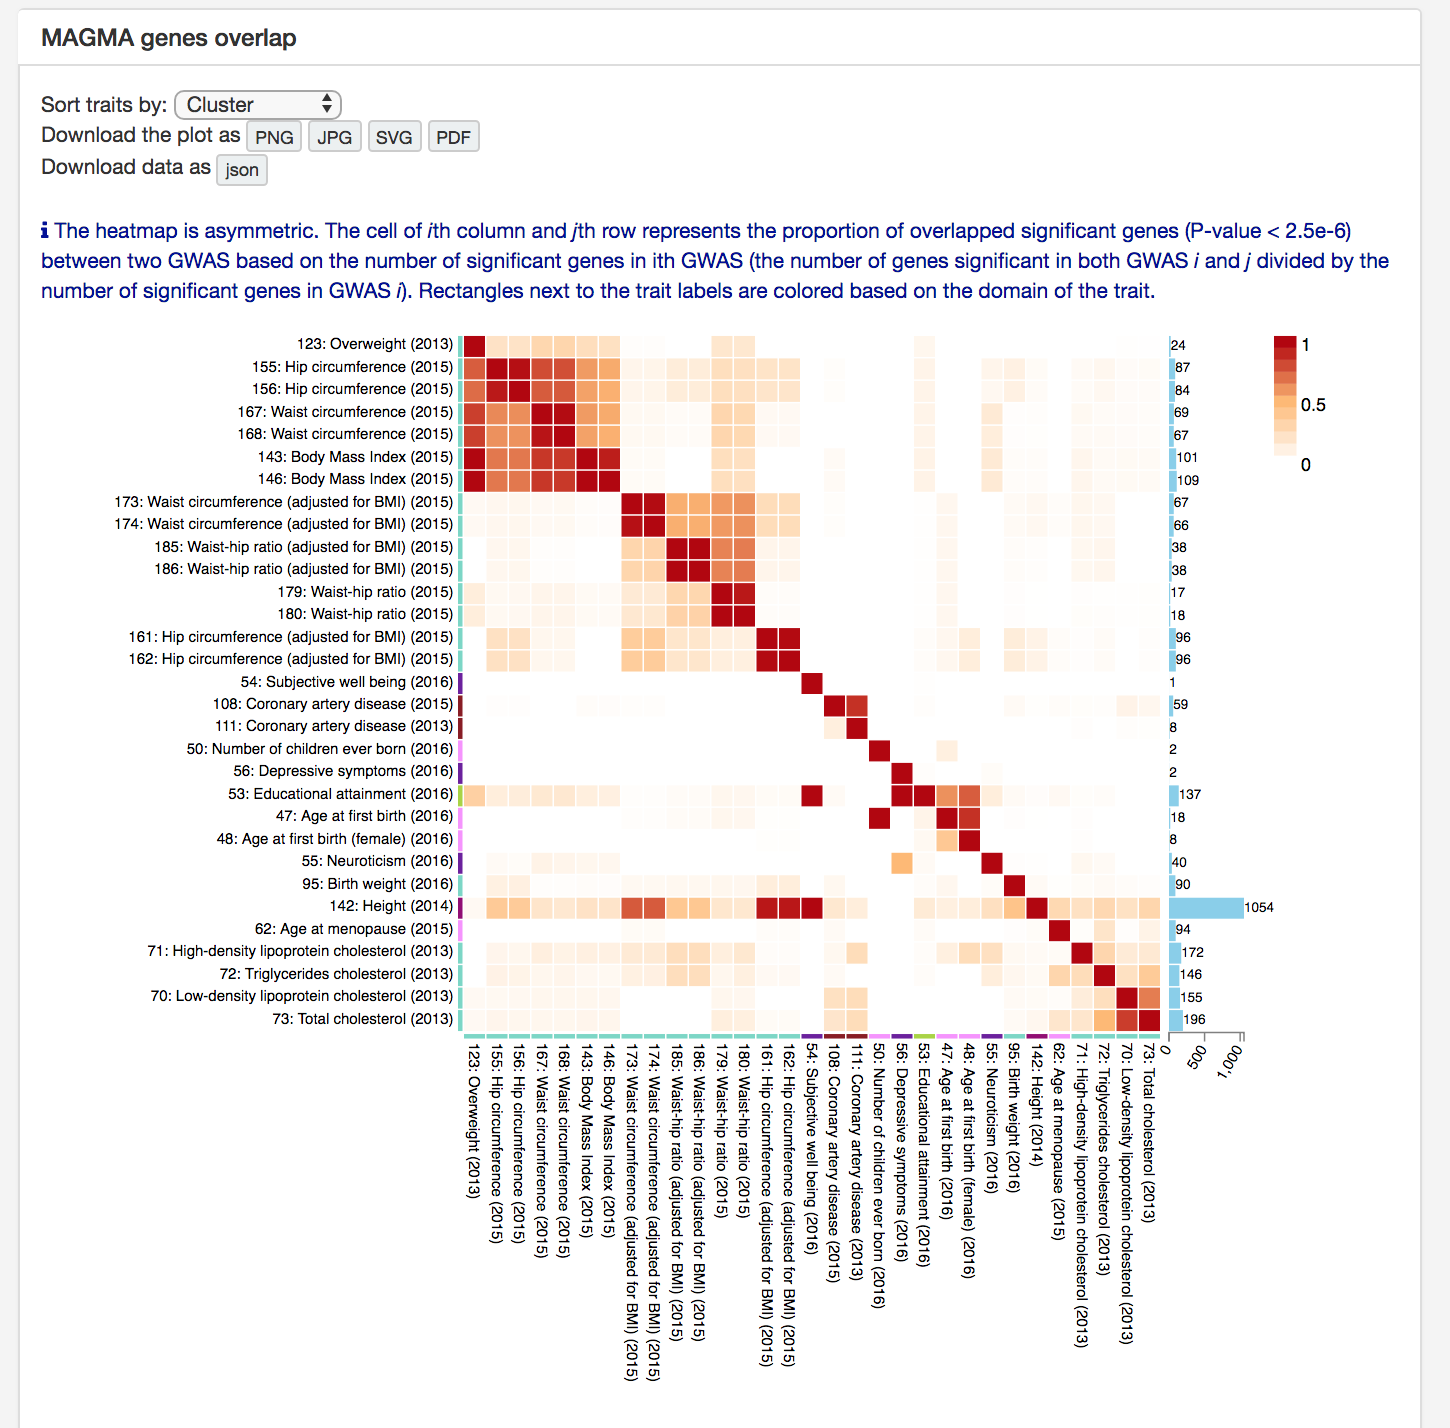
There are two types of comparison for significant genes based on MAGMA gene analyses.
First comparison is to compare how many significant genes are shared between GWAS.
The heatmap shows the proportion of shared significant genes and the number of significant genes at the right side.
Note that the heatmap is asymmetric.
GWAS can be sorted by alphabetically, trait domain or hierarchical clustering.
The plot can be downloaded as a image and data can be downloaded in json format.
The downloaded json file can be used to customise the plot with j3.ds script available at
https://github.com/Kyoko-wtnb/GWASatlas-plots.
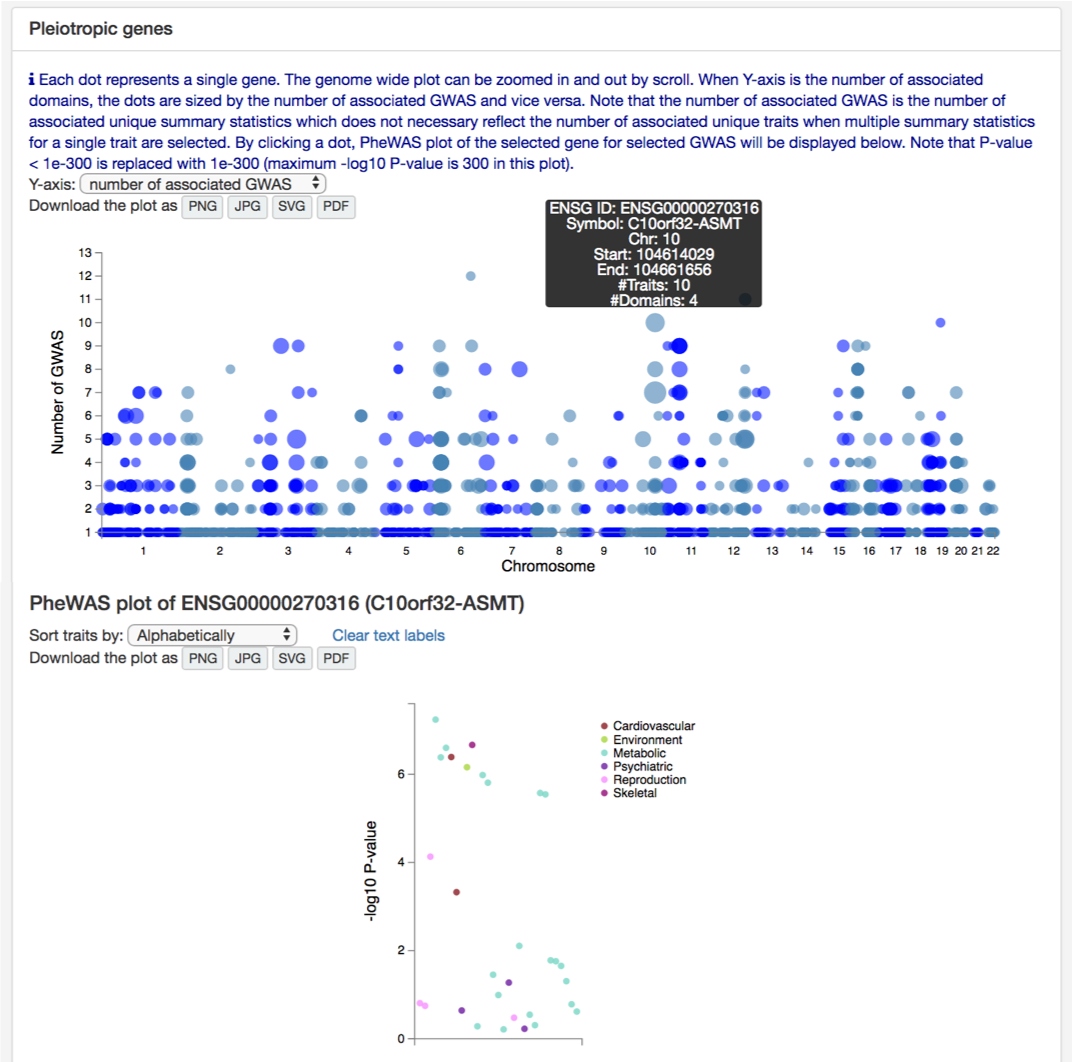
Second comparison is to compare the number of associated GWAS per gene. At the bottom of "Multiple GWAS Comparison" page, there is a manhattan like plot for pleiotropic genes. Y-axis is the number of associated domains by default which can be changed to the number or associated GWAS (the bottom plot uses number of associated GWAS for Y-axis). As a measure of pleiotropy, we recommend to use the number of associated domains when you have multiple traits from multiple domains since traits within a domain tend to have higher phenotypic correlation. When you are comparing traits within one or a few domains, or you don't suspect high phenotypic correlation between selected traits within a domain, the number of associated GWAS might be better measurement for pleiotropy. Note that the number of associated GWAS is the number of unique summary statistics. Therefore, this does not necessary represent the number of unique trait when multiple summary statistics for a single trait are selected.
By clicking one of the genes, you can display PheWAS plot for the selected GWAS.
By default, only GWAS with P-value < 0.05 are displayed.
You can first try changing the P-value.
Note that for SNPs, P-value 0.05 is the maximum threshold.
It is also possible that the selected gene or SNP is not tested in the selected GWAS.
When you are searching by gene name, please also try different alias of the gene if there is any.